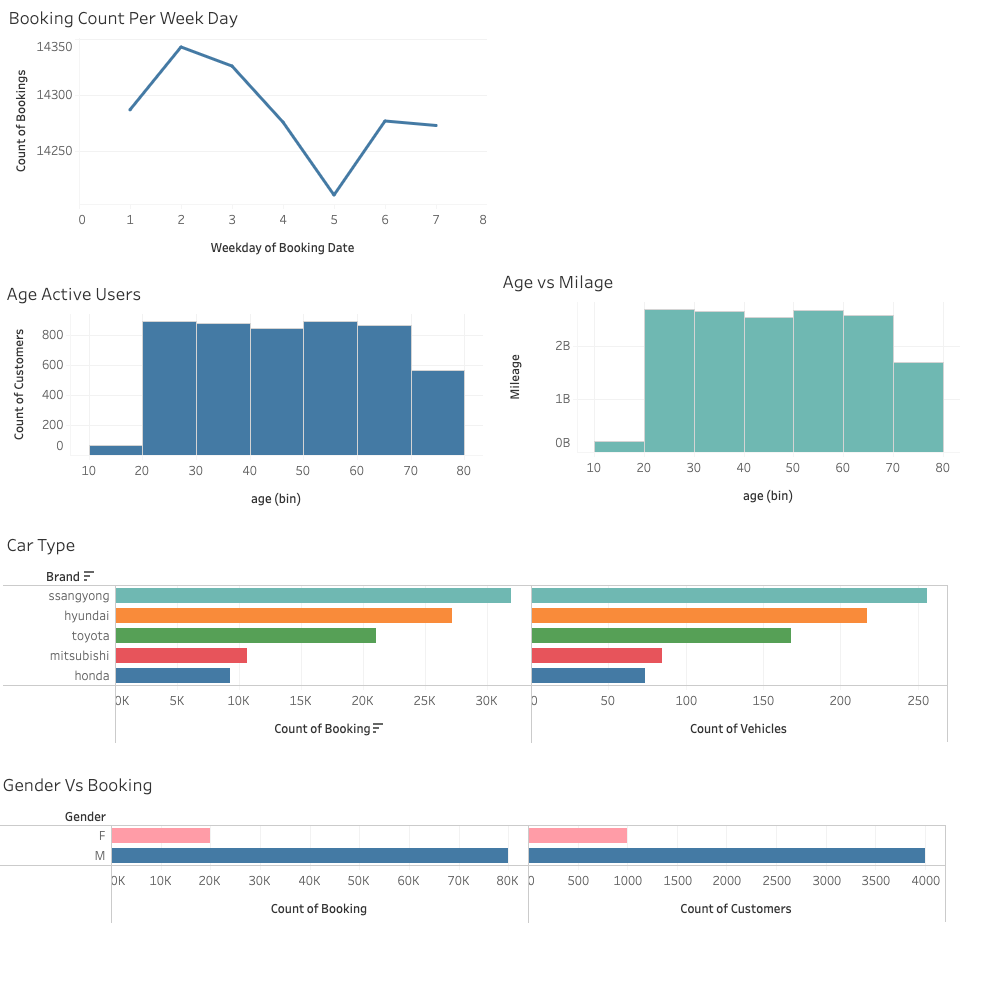
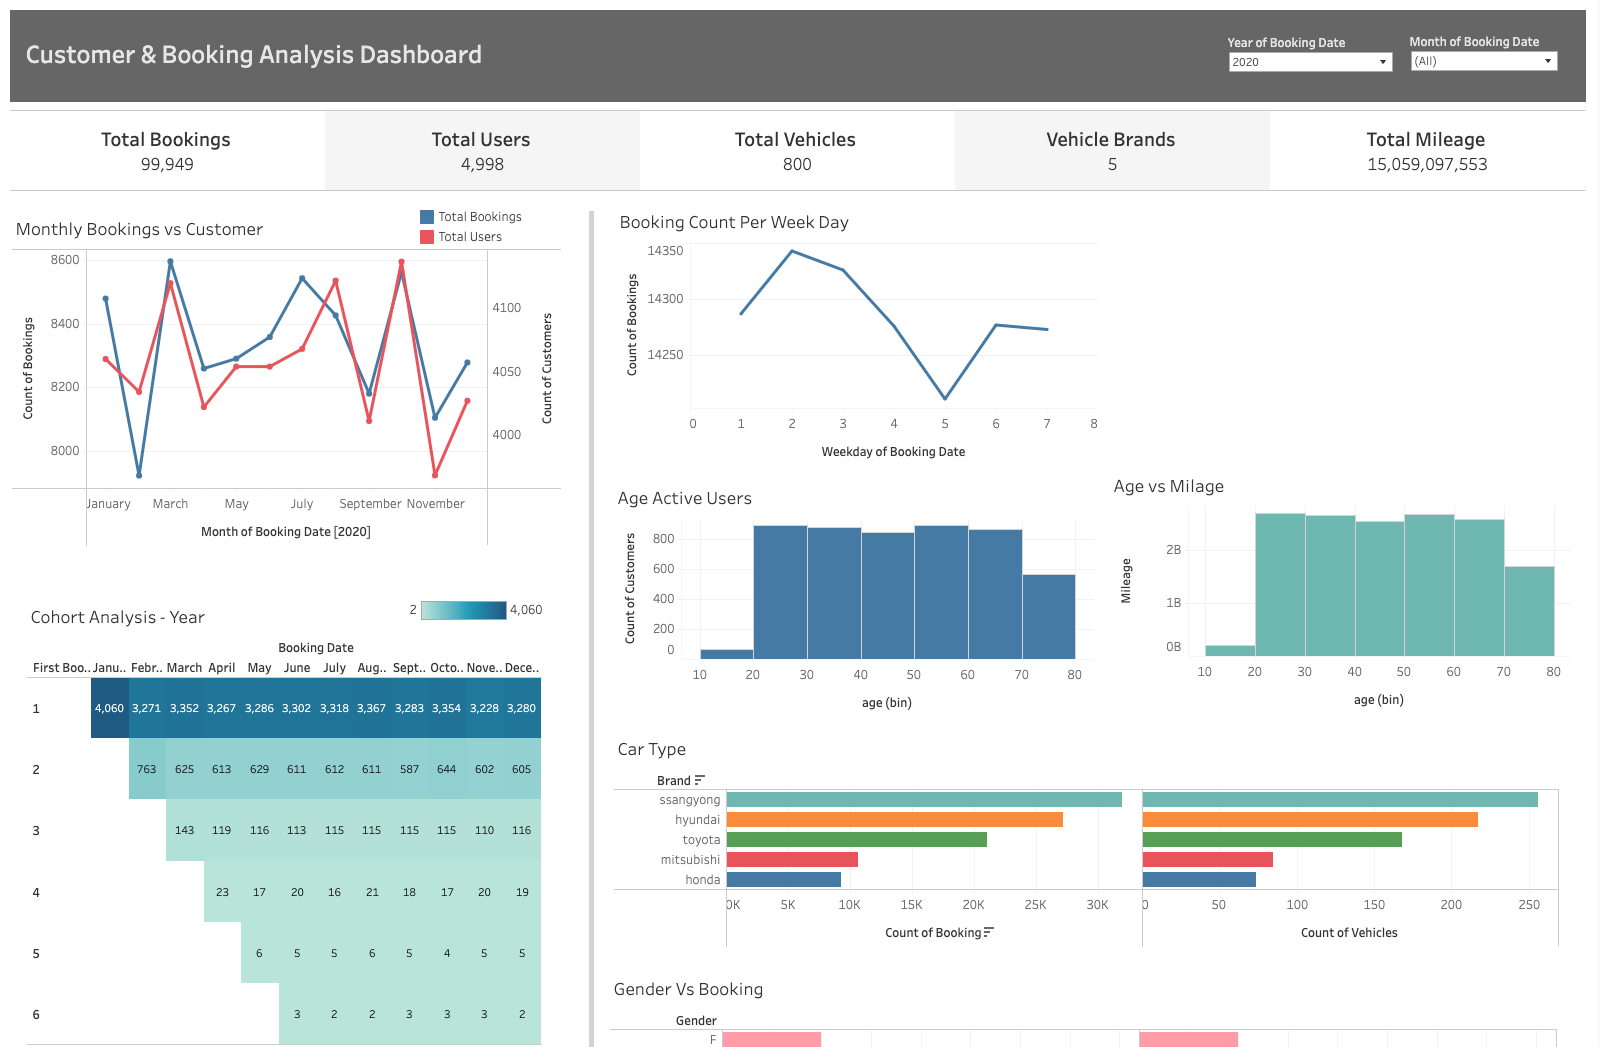
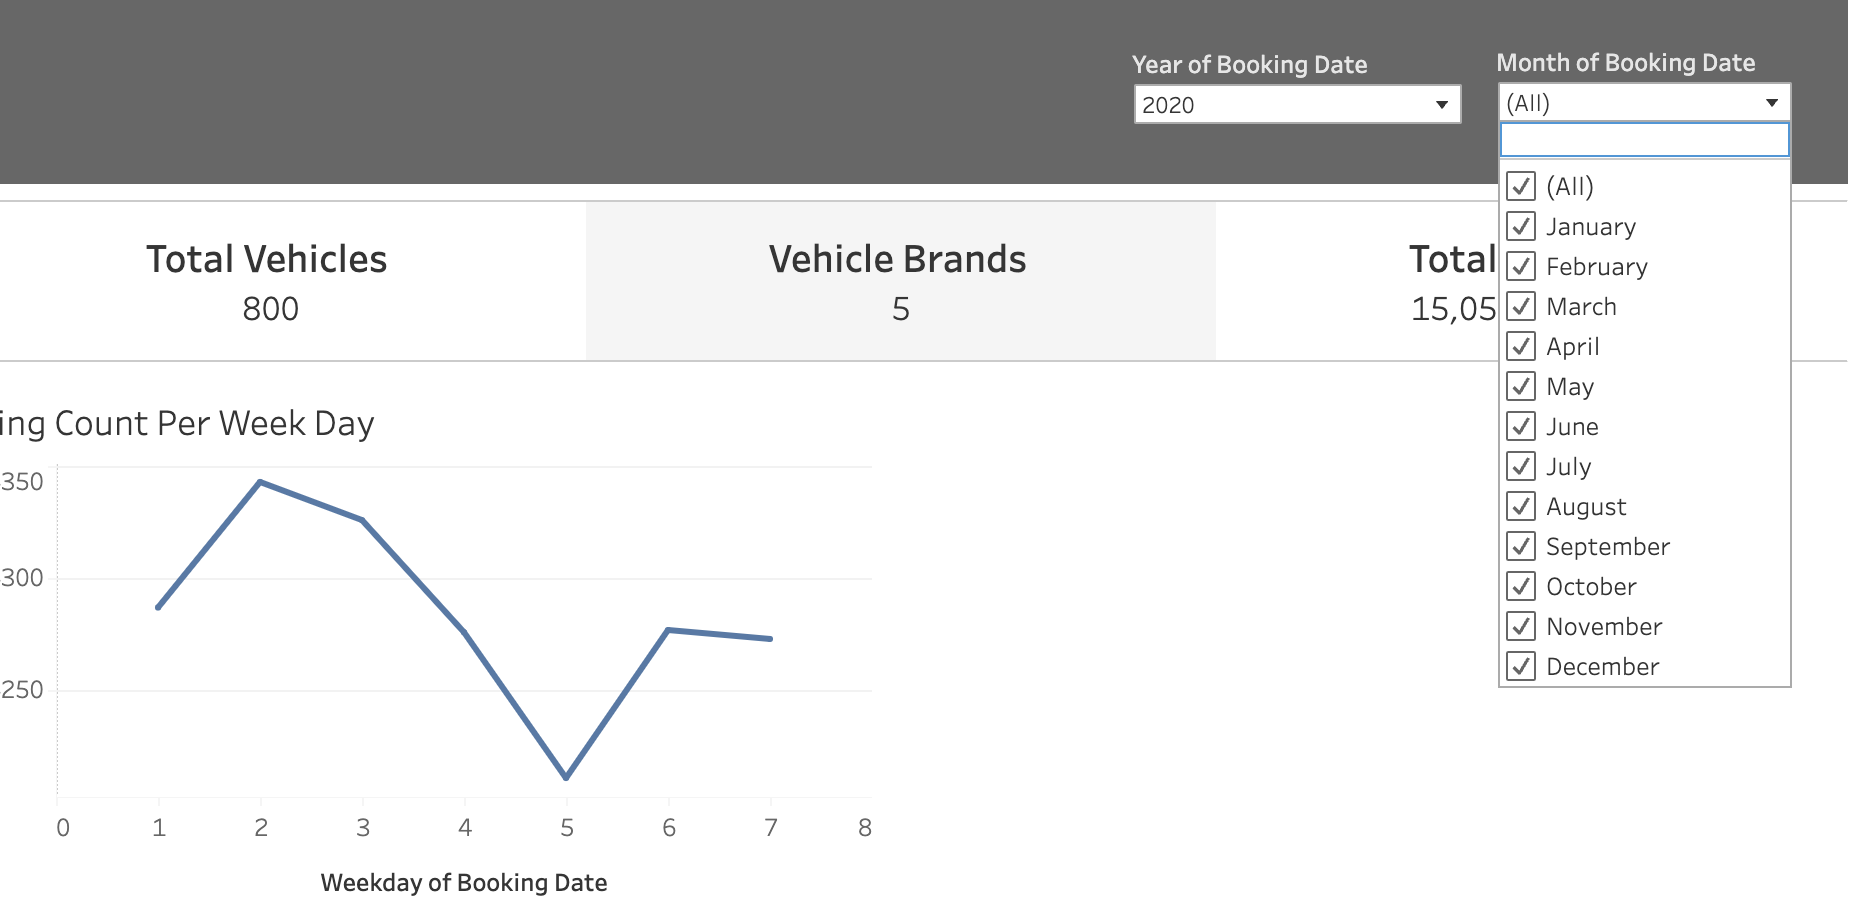
The dashboard was designed to highlight specific aspects of user behavior related to booking a ride. The data sources were aggregated, cleansed, and combined to create a Tableau dashboard for user behavior and retention analysis. The dashboard features interactive visualizations and filters to help stakeholders gather insights.
To improve the efficiency of data retrieval for frontend display, an engineering solution was implemented for data storage and processing based on the provided data sets.
To secure the data architecture, a conceptual plan was designed to illustrate the steps and strategies involved. This plan may include measures such as encryption, access controls, and regular security audits.
Tableau Public URL
- Tableau
- Python
- Databricks
Skills Developed:
- Data Transformation
- ETL
- Data Visualization
Interactive Tableau dashboard provides in-depth analysis of ride booking data


