
Hypothesis testing is a statistical method that allows us to test our ideas or assumptions about a population. It is commonly used in research and data analysis to evaluate whether a sample supports our assumptions about the population.
In this article, we will use a business problem to explain the concept of hypothesis testing.
Suppose that your marketing lead claims that the average time users spend on the company website’s homepage after their first login is less than or equal to 60 seconds. However, you believe that the average time should be higher than 60 seconds. To test this claim, you decide to collect a sample of 100 users and measure the average time they spend on the homepage. The resulting average time is 85 seconds.
To solve this problem, we can use hypothesis testing to determine whether the sample supports or refutes our original assumption about the population. Hypothesis testing involves four steps:
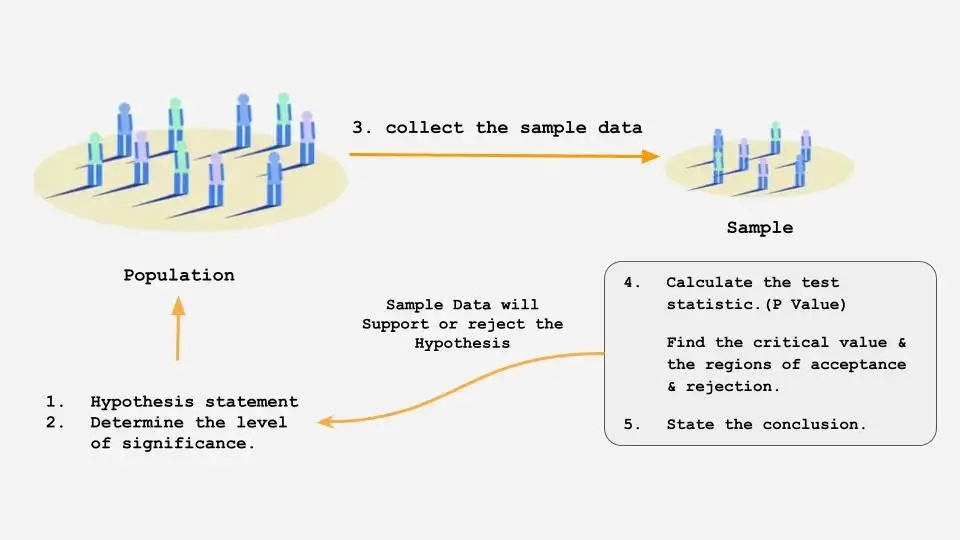
- State the null and alternative hypotheses.
- State a null hypothesis about a value in the population (Ho) and an alternative hypothesis(Ha) that contradicts the null hypothesis.
- Determine the level of significance.
- Set the criteria for a decision. A criterion is set upon which a researcher will decide whether to retain or reject the value stated in the null hypothesis. A sample is selected from the population, and a sample mean is measured.
- Calculate the test statistic.
- Compute the test statistic. The value of the test statistic is used to make a decision regarding the null hypothesis. This will produce a value that can be compared to the criterion that was set before the sample was selected.
- State the conclusion.
- Make a decision. If the probability of obtaining a sample mean is less than Significnace level when the null is true, then reject the null hypothesis. If the probability of obtaining a sample mean is greater than Significnace level when the null is true, then retain the null hypothesis.
It is important to note that this process, also known as inferential statistics, allows us to make inferences about the population based on the information we have about the sample.
Before diving deeper into hypothesis testing, it is useful to understand the concept of the normal distribution and the central limit theorem (CLT).
The CLT states that the distribution of sample means or sample population proportions approximates a normal distribution as the sample size increases, regardless of the distribution of the population.
- This means that when we take the sample mean or population proportion from a relatively large sample, we can safely assume that it follows a normal distribution.
- There are formulas that can be used to verify this, but for the purpose of simplicity, we will not cover them in this article.
The method in which we select samples to learn more about characteristics in a given population is called hypothesis testing. In other words, we test some hypotheses by determining the likelihood that a sample statistic could have been selected, if the hypothesis regarding the population parameter were true.
The later part of this article will explain each step of the hypothesis testing.
- State the hypothesis
- It is a statement of expectation about a population parameter that we develop to test it (average time spent is less than or equal to 60 Seconds).
- In any hypothesis test, the first thing we always want to do is state what is called the null and alternative hypotheses.
- Every hypothesis test contains this set of two opposing statements about a population parameter.
- We begin by stating the value of a population mean or Population proportion in a null hypothesis.
When an accused is on trial, the court starts by assuming that the accused is innocent. The basis of the decision is to determine whether this assumption is valid. Likewise, in hypothesis testing, we start by assuming that the hypothesis we are testing is true. We always test the null hypothesis Ho, not the alternative hypothesis Ha. We say that if our sample gives us good enough evidence, we can reject the null hypothesis and provide evidence supporting our alternative hypothesis.
- The only reason we are testing the null hypothesis is that we think it is wrong. We state what we believe is wrong about the null hypothesis in an alternative hypothesis. The alternative hypothesis, Ha, is the abnormality we’re looking for in the data. It is the significance we expect to find.
- Ho — State the Null hypothesis It states , What is the base line claim?
- Ha — State the Alternate hypothesis It’s a claim that repudiating the alternate hypothesis.
- In our example, if our marketing lead claims that the users, on average, spend time less than or equal to 60 Seconds, then this 60 Seconds figure is the status quo; it’s our normal baseline; it should be our null hypothesis.
- If we then want to test this claim to see if we can find interesting new data that shows that the marketing lead’s claim is wrong, then we would be looking for data that goes against their stated figure. So the alternative hypothesis will be that the average time spent contradicts what the marketing lead has stated.
- Ha: average time spent is less than or equal to 60 Seconds
- Ho: average time spent is greate than 60 Seconds
- Significance
- To set the criteria for a decision, we state the level of significance for a test. This is similar to the judgment in the court. The judge decides whether the evidence presented shows guilt beyond a reasonable doubt. Likewise, we collect data in hypothesis testing to show that the null hypothesis is not true, based on the likelihood of selecting a sample mean from a population.
- When we take a sample to investigate our null hypothesis, we usually pick a confidence level of 90%, 95 %, or 99 % and these correspond to the Significnace levels (alpha value) of 10%, 5%, or 1%. If we collected the data that falls at that significant level then we say that the result is significant, that is extreme results.
- In our example, the claim is that users, on average, spend 60 Seconds on the home page. Most samples we select should have a mean close to or equal to 60 Seconds if the claim we are testing is true. So at what point do we decide that the discrepancy between the sample mean and 60 Seconds is so big that the claim we are testing is likely, not true? We answer this question in this step of hypothesis testing.
- Let’s take 5% of Significnace level for our example.
Please note that there are exceptions out there.
- Incase you are certain that null hypothesis is the actual truth and your sample states that null hypothesis is incorrect. what that then also means is that even you collected enough evidence that got you into that significant region where null hypothesis still be correct. Here the significance level represents the probability of incorrectly rejecting the null hypothesis.
- This is called as the type 1 error.
- Calculate the test statistic.
- Suppose we measure a sample mean equal to 85 Seconds. To make a decision, we need to evaluate how likely this sample outcome is, if the population mean stated by the null hypothesis (60 seconds) is true.
- We use a test statistic to determine this likelihood. Specifically, a test statistic tells us how far, or how many standard deviations, a sample mean is from the population mean. The larger the value of the test statistic, the further the distance, or number of standard deviations, a sample mean is from the population mean stated in the null hypothesis.
- The test statistic is a mathematical formula that allows researchers to determine the likelihood of obtaining sample outcomes if the null hypothesis were true. The value of the test statistic is used to make a decision regarding the null hypothesis. There are a variety of statistical tests available. Most commonly used statistics are T-test and Z-Test.
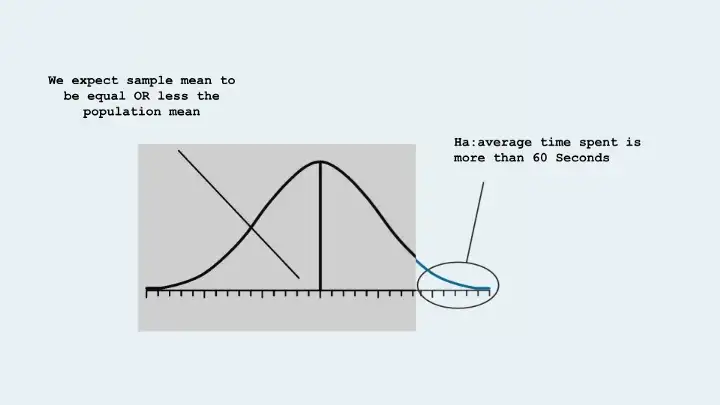
- Based on the Hypothesis testing we have to take One of the first steps is to look up a z-score or T-score, and in order to do that, you need to know if it’s a one-tailed test or two. You can figure this out in just a couple of steps.
- if there is inequality involved then it involved only either of one tail (lower or upper)
- if there is equalaity involved then it involves Two tails.
- In our example, we can look for the probability of obtaining a sample mean beyond 2 Standard Deviation in the upper tail (greater than 60). The above figure shows that the alternative hypothesis is used to determine which tail or tails to place the level of significance for a hypothesis test.
- Say we use the Z test for our purpose. We know that the alpha or Significance threshold (5%) is the rejection region. if our calculated Z value falls above 95% (less than the significance level ) We can reject the null hypothesis.
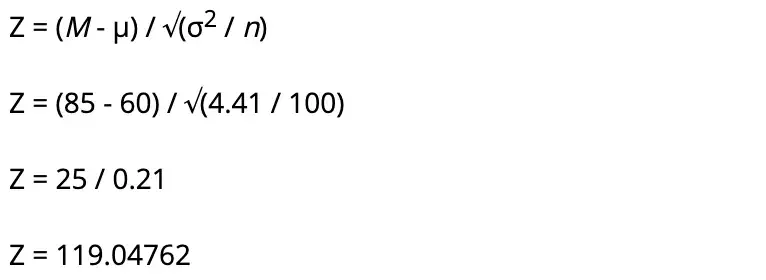
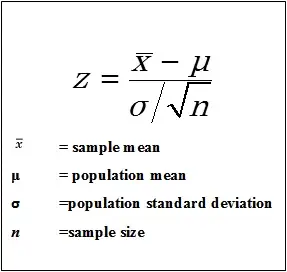
- Let’s calculate the Z statistics. We use this formula to calcualate the Z test.
- Let’s assume that the population Standard deviation is 2.1. So the Z value will be
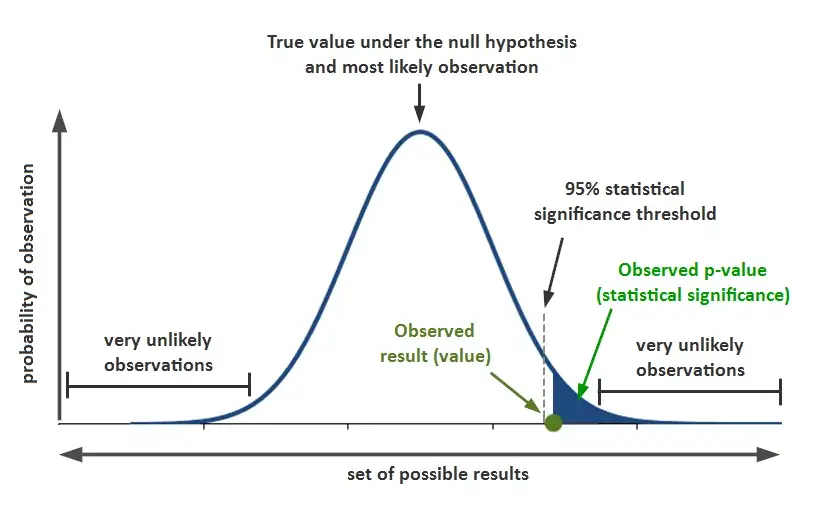
- State the conclusion.
- We use the test statistic’s value to decide about the null hypothesis. The decision is based on the probability of obtaining a sample mean, given that the value stated in the null hypothesis is true.
- We use the test statistic’s value to decide about the null hypothesis. The decision is based on the probability of obtaining a sample mean, given that the value stated in the null hypothesis is true.
In summary
- Reject the null hypothesis. The sample mean is associated with a low probability of occurrence when the null hypothesis is true.
- Retain the null hypothesis. The sample mean is associated with a high probability of occurrence when the null hypothesis is true.
The probability of obtaining a sample mean, given that the value stated in the null hypothesis is true, is stated by the p value. If you would like to know more about the p value , One tail test, two tail test have a look at this tutorial. In our example, if you observe the p-value in the z table, the value of p is < .00001. The result is significant at p < .05.
So we can reject the null hypothesis and conclude that the marketing lead’s Claim is wrong. Hence it’s the Judgement. :)
I hope you found this helpful article. Thanks for Reading!


